

Pre-design geophysical analysis guides the aperture and spatial sampling requirements to capture sufficient data to image the target.

Describe the external factors affecting your project : Borders, boundaries, bathymetry, tides, currents, exclusion areas, etc.

Any number of vessels can be defined - each having any number of sources and streamers. TesserACT then computes the most cost effective shooting plan.

A full suite of manual and automated hazard avoidance tools is available.

A time and space variant current model (e.g. SeisIntel) can be used to evaluate ... and minimize ... infill acquisition that results from feather mis-matches on adjacent lines.
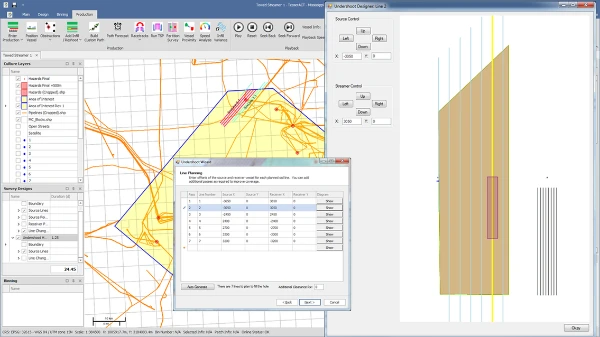
A suite of tools is available to handle undershoots, deadheading and "boxing-in".

A full suite of coverage analysis tools include fold, offsets, rose plots, waterfall plots, etc.

X axis is bin number Y axis is offset

2D surveys can be optimized using a time and space variant current model
Pre-design geophysical analysis guides the aperture and spatial sampling requirements to capture sufficient data to image the target.
Describe the external factors affecting your project : Borders, boundaries, bathymetry, tides, currents, exclusion areas, etc.
Any number of vessels can be defined - each having any number of sources and streamers. TesserACT then computes the most cost effective shooting plan.
A full suite of manual and automated hazard avoidance tools is available.
A time and space variant current model (e.g. SeisIntel) can be used to evaluate ... and minimize ... infill acquisition that results from feather mis-matches on adjacent lines.
A suite of tools is available to handle undershoots, deadheading and "boxing-in".
A full suite of coverage analysis tools include fold, offsets, rose plots, waterfall plots, etc.
X axis is bin number Y axis is offset
2D surveys can be optimized using a time and space variant current model

In this example bathymetry is used both for accurate operational modelling and fold coverage estimation.

Parallel, orthogonal and arbitrary geometries are supported. Manual and automated hazard avoidance tools are available.

Standard templates are available for common roll patterns, with a flexible interactive roll editor that can handle more unusual cases!

Fold, minimum offset and maximum offset are available for PP and PS coverage. Display can be filtered based on offsets, azimuths, critical angles etc.

Detailed line level and bin level displays, colored by attribute are available.

This example shows the impact of shooting on line changes.

Full suite of operational analysis, including operational constraints like node battery life.

Node inventory tracking throughout the project (on seabed vs on vessel).

View and interpret source and receiver vessel utilization rates.

As acquired data can be compared with planned acquisition, and estimated time to complete can be continuously updated.
In this example bathymetry is used both for accurate operational modelling and fold coverage estimation.
Parallel, orthogonal and arbitrary geometries are supported. Manual and automated hazard avoidance tools are available.
Standard templates are available for common roll patterns, with a flexible interactive roll editor that can handle more unusual cases!
Fold, minimum offset and maximum offset are available for PP and PS coverage. Display can be filtered based on offsets, azimuths, critical angles etc.
Detailed line level and bin level displays, colored by attribute are available.
This example shows the impact of shooting on line changes.
Full suite of operational analysis, including operational constraints like node battery life.
Node inventory tracking throughout the project (on seabed vs on vessel).
View and interpret source and receiver vessel utilization rates.
As acquired data can be compared with planned acquisition, and estimated time to complete can be continuously updated.

Load built in culture data sources and import your own.

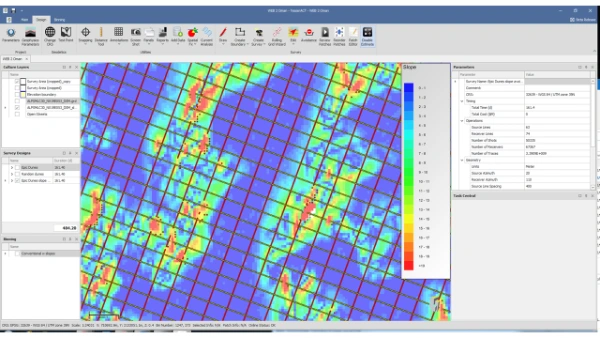
This example shows the topography associated with dunes.

Slopes are important from a safety perspective.

In this case, a 300m Receiver grid has been created orthogonal to a 400m Source grid. An initial time and cost estimate is now available.
In this case, vibes are limited to 20 degrees with receivers limited to 30 degrees

In this case, vibes are limited to 20 degrees with receivers limited to 30 degrees

Minimum offset display indicates manageable coverage holes around the slope exclusion zones.

Fold map shown with single bin offset vs azimuth display.

A number of randomization strategies are available to support Compressive sensing.

A number of randomization strategies are available to support Compressive sensing.

In this case, the challenge was to avoid buildings.
Load built in culture data sources and import your own.
This example shows the topography associated with dunes.
Slopes are important from a safety perspective.
In this case, a 300m Receiver grid has been created orthogonal to a 400m Source grid. An initial time and cost estimate is now available.
In this case, vibes are limited to 20 degrees with receivers limited to 30 degrees
In this case, vibes are limited to 20 degrees with receivers limited to 30 degrees
Minimum offset display indicates manageable coverage holes around the slope exclusion zones.
Fold map shown with single bin offset vs azimuth display.
A number of randomization strategies are available to support Compressive sensing.
A number of randomization strategies are available to support Compressive sensing.
In this case, the challenge was to avoid buildings.

Elevations, satellite imagery, drone/lidar data, block boundaries, etc.

Adjacent surveys can also be imported (SPS etc.)

Each terrain can have it's own properties (deploy/recover rate etc.)

Flexible roll tools.

Multiple automated and manual hazard avoidance, exclusion and snapping tools are available.

Minimum offset plot shows hole in coverage due to exclusion areas around islands in the lagoon.

Fold plot ... whole survey.
Elevations, satellite imagery, drone/lidar data, block boundaries, etc.
Adjacent surveys can also be imported (SPS etc.)
Each terrain can have it's own properties (deploy/recover rate etc.)
Flexible roll tools.
Multiple automated and manual hazard avoidance, exclusion and snapping tools are available.
Minimum offset plot shows hole in coverage due to exclusion areas around islands in the lagoon.
Fold plot ... whole survey.

Coverage is assessed at each target horizon.

Variable density spirals offer a cost effective survey option. Density is variable in-line and crossline.

Target at 8,000 m Shown with blocl boundaries and shot line.

Target at 8,000 m Shown with blocl boundaries and shot line.

Target at 10,000 m.

Target at 12,000 m.
Target at 12,000 m.

Coverage maps can be weighted based on PP or PS DAS response.

Coverage is assessed at each target horizon.
Variable density spirals offer a cost effective survey option. Density is variable in-line and crossline.
Target at 8,000 m Shown with blocl boundaries and shot line.
Target at 8,000 m Shown with blocl boundaries and shot line.
Target at 10,000 m.
Target at 12,000 m.
Coverage maps can be weighted based on PP or PS DAS response.

In this example an NOAR grid has been designed to simulate the coverage from a towed streamer survey.

Fold map (streamer data only) with deployed node locations shown.

Fold map (streamer data + streamer shots into ) with deployed node locations shown.

Minimum offset (streamer data only) with deployed node locations shown.

Minimum offset (streamer data + streamer shots into ) with deployed node locations shown.

Fold map (streamer data only) with crossline offset distribution and deployed node locations shown.

Fold map (streamer data plus streamer shots into nodes) with crossline offset distribution and deployed node locations shown.

Streamer lines and node locations shown. Dense nodes for undershoot. Sparse nodes for FWI.

Fold map (Streamer data + streamer shot into nodes) Node locations shown. Dense nodes for undershoot. Sparse nodes for FWI.

Fold map (Streamer data + streamer shot into nodes) and offset distribution to 25,000m Node locations shown. Dense nodes for undershoot. Sparse nodes for FWI.

Fold map (Streamer data + streamer shot into nodes) with offset/azimuth distribution to 25,000m Node locations shown. Dense nodes for undershoot. Sparse nodes for FWI.
In this example an NOAR grid has been designed to simulate the coverage from a towed streamer survey.
Fold map (streamer data only) with deployed node locations shown.
Fold map (streamer data + streamer shots into ) with deployed node locations shown.
Minimum offset (streamer data only) with deployed node locations shown.
Minimum offset (streamer data + streamer shots into ) with deployed node locations shown.
Fold map (streamer data only) with crossline offset distribution and deployed node locations shown.
Fold map (streamer data plus streamer shots into nodes) with crossline offset distribution and deployed node locations shown.
Streamer lines and node locations shown. Dense nodes for undershoot. Sparse nodes for FWI.
Fold map (Streamer data + streamer shot into nodes) Node locations shown. Dense nodes for undershoot. Sparse nodes for FWI.
Fold map (Streamer data + streamer shot into nodes) and offset distribution to 25,000m Node locations shown. Dense nodes for undershoot. Sparse nodes for FWI.
Fold map (Streamer data + streamer shot into nodes) with offset/azimuth distribution to 25,000m Node locations shown. Dense nodes for undershoot. Sparse nodes for FWI.
